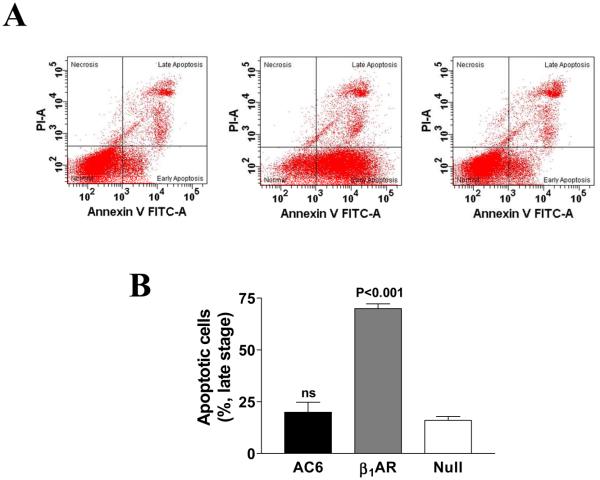
Figure 2. Flow cytometry analysis of cardiac myocyte apoptosis.
A. Cardiac myocytes incubated for 12h with Ad.AC6, Ad.β1AR, or Ad.Null were stained with Annexin V-FITC and propidium iodide (PI). Quantification of apoptotic cells was achieved by flow cytometric analysis. The quadrant lines were set based on Ad.Null control to separate normal cells (double negatives) from cell populations that were either PI positive, Annexin V positive, or both PI and Annexin V positive. Representative graphs from three independent experiments are shown. Gene transfer of β1AR, but not AC6, increased early stage myocyte apoptosis.
B. Late stage apoptosis. Cardiac myocytes incubated for 72h with Ad.AC6, Ad.β1AR, or Ad.Null were stained with Annexin V-FITC and propidium iodide (PI) and analyzed using flow cytometry. Bars in graph denotes mean±SD derived from three independent experiments. Comparisons were conducted using one-way ANOVA, followed by Bonferroni t-testing. Gene transfer of β1AR, but not AC6, increased late stage myocyte apoptosis.

