
Figure 1.
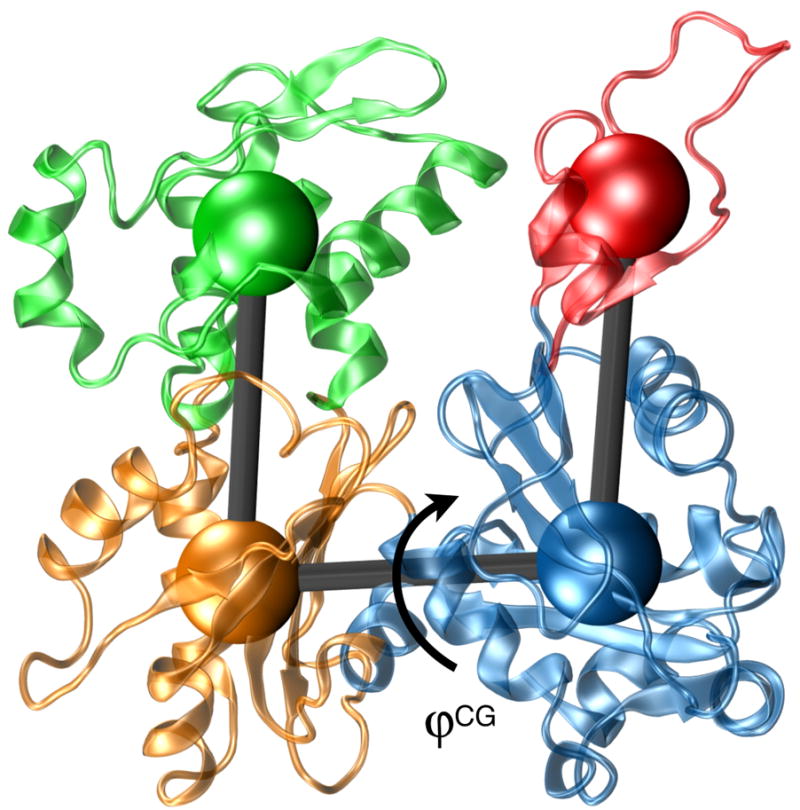
Actin subunit from the Oda et al.16 filament model in atomistic (cartoon) and coarse-grained (CG) representation. The four subdomains shown are: S1 (blue) residues 1-32, 70-144 and 338-375; S2 (red) residues 33-69; S3 (orange) residues 145-180 and 270-337; and S4 (green) residues 181-269. The cartoon representation of the protein is from PDB entry 2ZWH, and the “flatness” order parameter used for analysis is labeled.