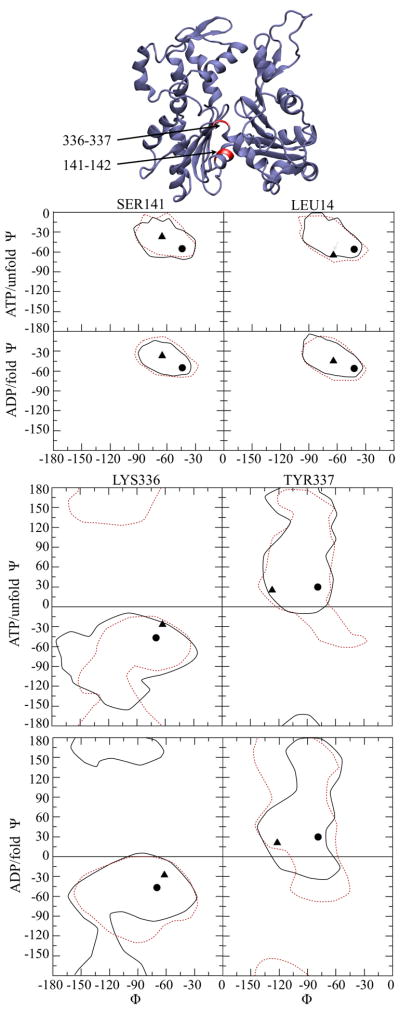
Figure 3.
Ramachandran plots for residues 141-142 and 336-337 in actin filaments derived from NPT MD simulations. The initial values for the Oda and Holmes filaments are represented by circle and triangles, respectively. The regions encompassing the values observed during MD simulation are marked with a dashed line (Oda) or solid line (Holmes). The lines are drawn with a contour level that encloses 100% of the observed backbone angles for the specific residues that are indicated. The Oda actin subunit is shown at the top with the residues of interest labeled in red.

