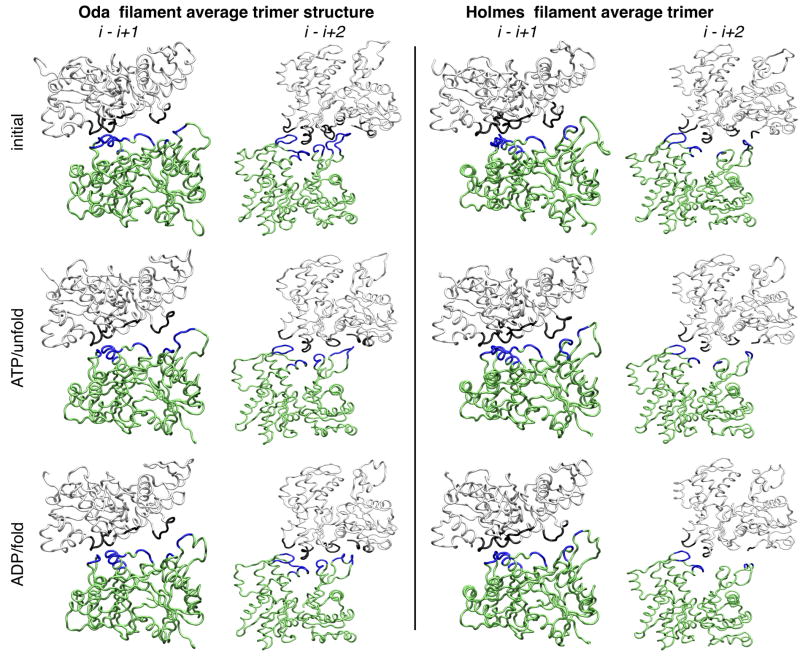
Figure 4.
Inter-subunit contact architecture of Oda and Holmes actin filaments derived from MD simulations. The average Cα position is depicted as a tube model to illustrate the cross-strand (i −i+1) and intra-strand (i −i+2) contacts. The initial structure is compared to the ATP/unfold and ADP/fold simulations. Contacts are shown in blue (subunit i) or black (subunits i+1 and i+2), and a contact is defined as two Cα atoms being less than 10 Å apart. Table S2 details the specific residues in contact for all of the models investigated.

