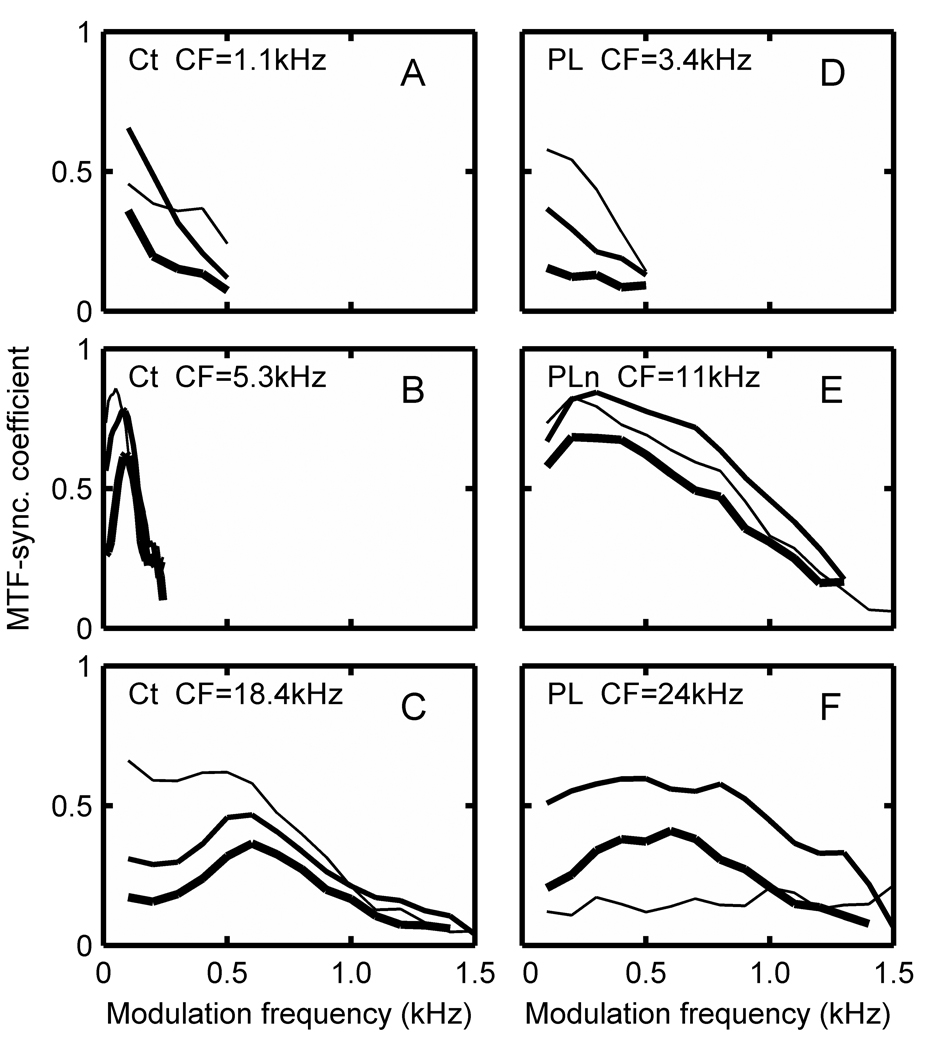
Figure 5.
Modulation transfer function synchronization coefficients of 3 example Ct (A–C), 2 PL (D, F), and PLn (E) neurons at 30 dB (thin line), 50dB (medium line), and 70dB (heavy line) plotted as a function of AM modulation frequency. CFs of individual cells are indicated. 2 squirrel monkey and 4 marmoset neurons were used for the example units.

