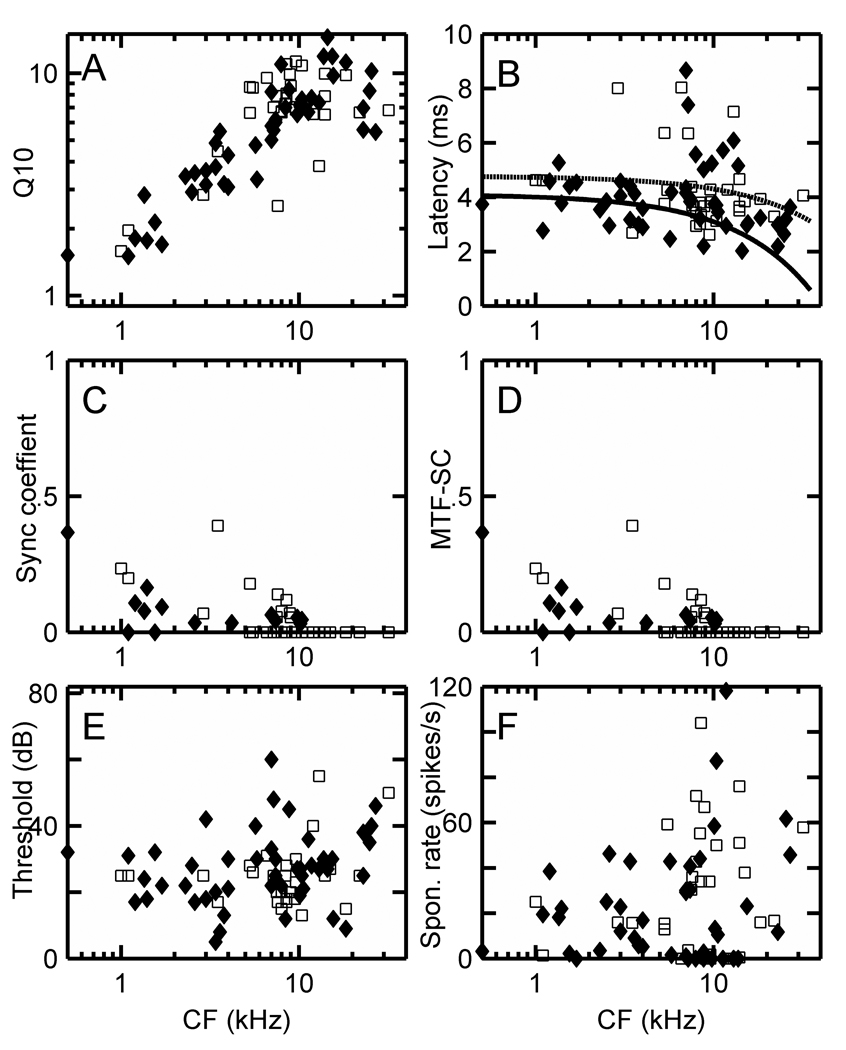
Figure 6.
(A) Q10 = CF/bandwidth at 10 dB above threshold on a log-log scale, (B) latency, (C) maximum synchronization coefficient from the PSTH at CF, (D) maximum MTF synchronization coefficient, (E) thresholds in dB, and (F) spontaneous rates in spikes/s for Ct units in the squirrel monkey (♦) and marmoset (□). The MTF-SC is the maximum value observed over the range of AM modulation frequencies (typically 50 – 2550 Hz) used for each unit. Regression lines were fitted to squirrel monkey (solid line) and marmoset (dashed line) latency data (B), and four outliers with latencies exceeding 8 ms were excluded from the fits.

