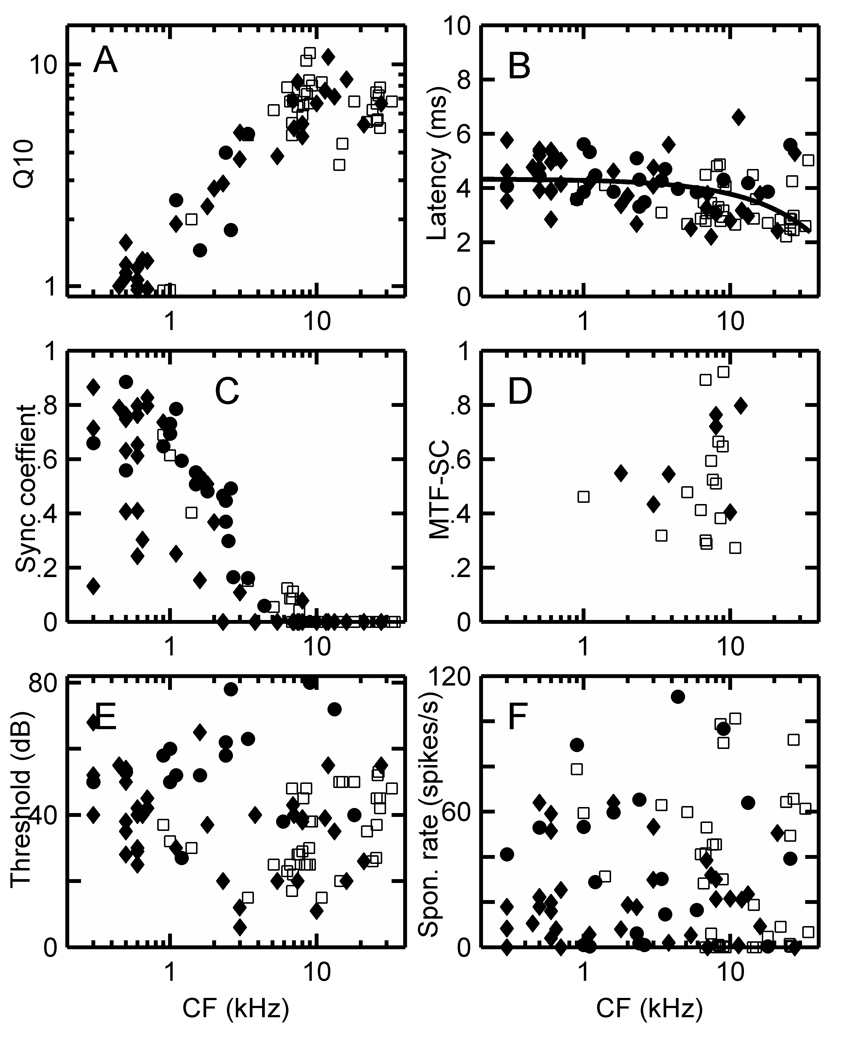
Figure 8.
(A) Q10, (B) latency, (C) synchronization coefficient from PSTH at CF, (D) maximum MTF synchronization coefficient values, (E) thresholds in dB, and (F) spontaneous rates in spikes/s for PL units in the squirrel monkey (♦), cynomolgus macaque (●), and marmoset (□). A regression line has been fitted to the combined latency data from all species in (B).

