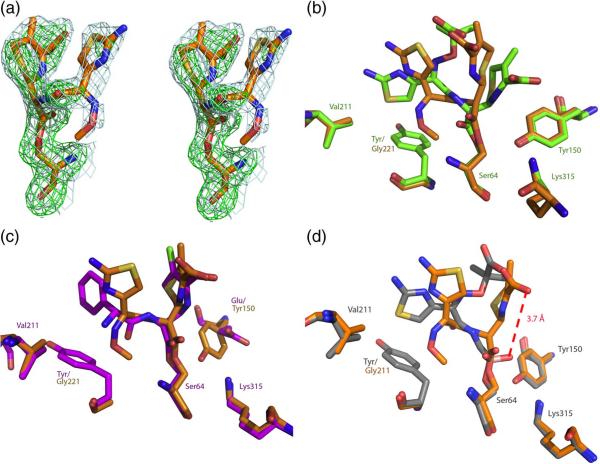
Figure 7.
X-ray structure of Y221G/cefotaxime (2.3 Å). (a) Stereo view of quality of density of cefotaxime in the active site of Y221G. 2Fo-Fc density (blue) is shown at a contour level of 1σ, and Fo-Fc.omit density (green) is shown at a contour level of 3σ. (b) The Y221G/cefotaxime structure (orange) overlaid with the WT/ceftazidime structure (green). (c) The Y221G/cefotaxime structure (orange) overlaid with the WT/loracarbef structure (purple). (d) The Y221G/cefotaxime structure (orange) overlaid with the WT/ceftazidime deacylation transition state analog (gray).

