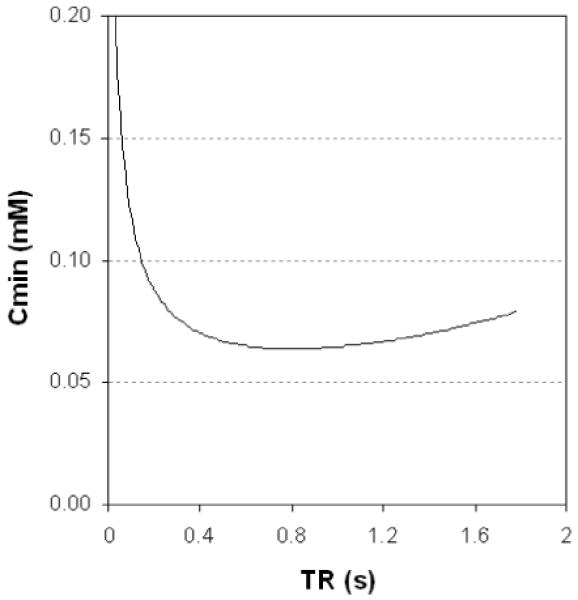
Figure 3.

Minimum detectable Mn2+ concentration as a function of TR (from eq 7), for a spin echo sequence. T10=1.6s, SNR0=5, NPe=256, Tex=20 min, r1=8 s-1 mM-1. The optimum TR is 800 ms (i.e. 0.5 T10 as previously found[25]), and at this TR Nav≈5. The curve is quite broad; TR can be in the range 0.4-1.4s without Cmin rising more than 10% above its optimised value, and in the range 0.3-1.7s without rising 20% above its optimised value.
