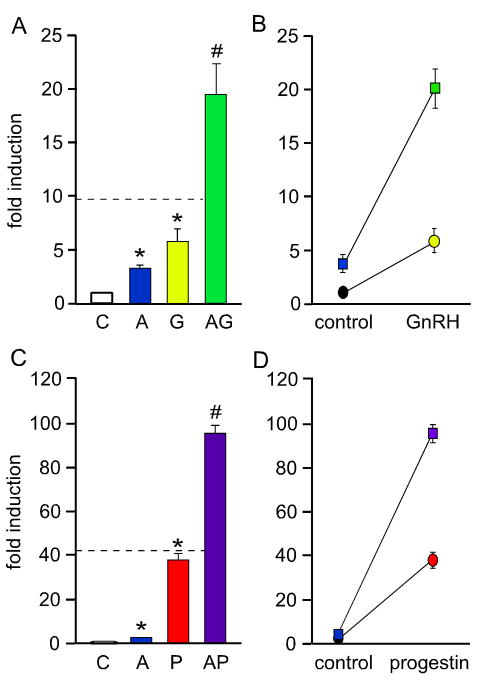
Fig. 2.
Activin synergizes with GnRH (A–B) or progesterone (C–D) to induce FSHβ gene expression. A luciferase reporter containing 1 kb of the mouse FSHβ promoter was transiently transfected into LβT2 cells. After overnight starvation in serum-free media, the cells were treated with vehicle control (C), 10 ng/μl activin (A), 10 nM GnRH (G), 100 nM R5020 (a synthetic progestin; P), activin and GnRH co-treatment (AG) or activin and progestin (AP), as indicated. The asterisks indicate significant differences from the vehicle-treated control, while pound signs indicate a synergistic interaction as defined by a two-way ANOVA (p<0.05). The dashed line in A and C represents the level at which the hormone co-treatment is additive rather than synergistic. In B and D, synergy is demonstrated graphically as described in Slinker et al. (Slinker, 1998). If the lines diverge, there is synergy, whereas if the lines remain parallel, there is no interaction. The circles represent control and GnRH (B) or progestin (D) treatment alone. The squares represent activin treatment, both alone and with GnRH (B) or progestin (D).

