
Fig. 2.
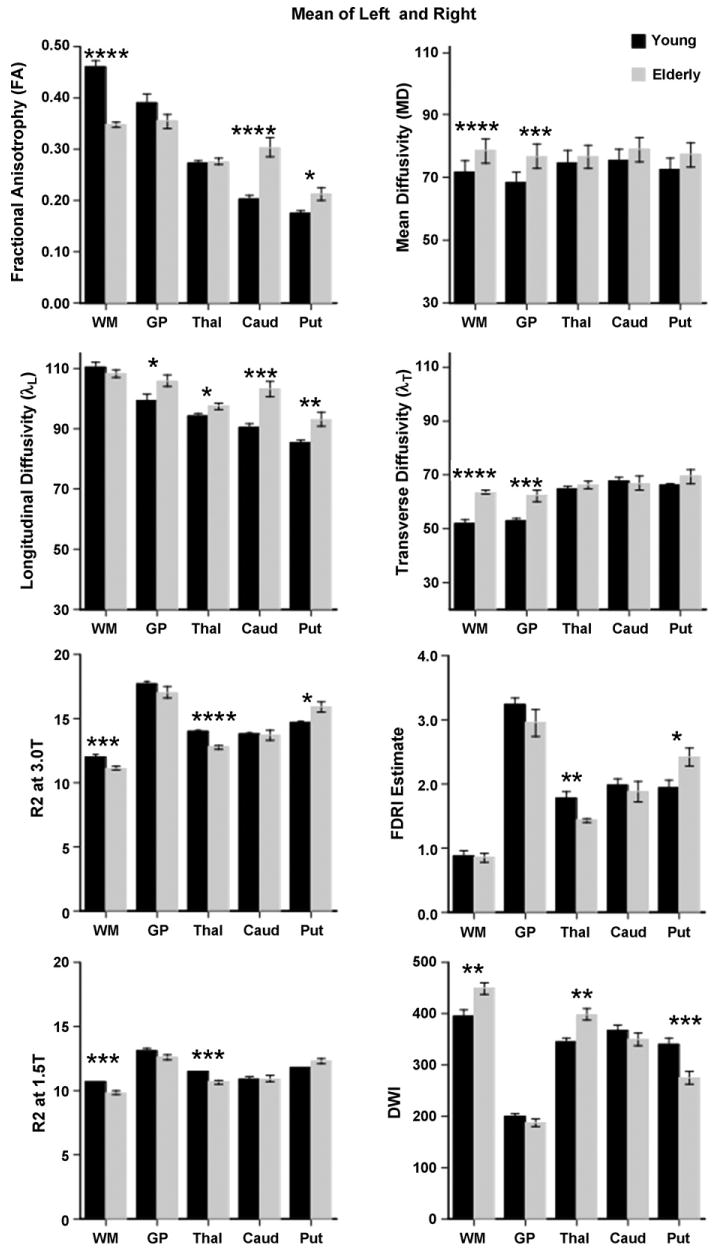
Mean ± S.E.M. of each bilateral DTI, MRI, and FDRI estimate metric for the young and elderly groups. *p ≤ .05, **p ≤ .01, ***p ≤ .001, and ****p ≤ .0001.
Official websites use .gov
A
.gov website belongs to an official
government organization in the United States.
Secure .gov websites use HTTPS
A lock (
) or https:// means you've safely
connected to the .gov website. Share sensitive
information only on official, secure websites.
Mean ± S.E.M. of each bilateral DTI, MRI, and FDRI estimate metric for the young and elderly groups. *p ≤ .05, **p ≤ .01, ***p ≤ .001, and ****p ≤ .0001.