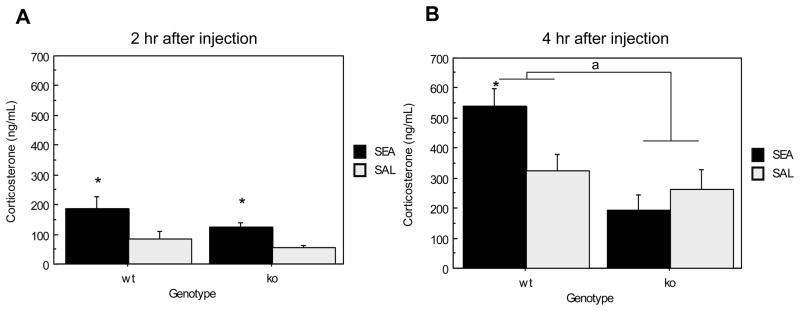
Figure 2.
Plasma corticosterone response to SEA 2 and 4 hrs after injection in ORL1+/+ and ORL1−/− mice. (A) 2 hours after injection; (B) 4 hours after injection.
Data are expressed as means ± standard error of the means (SEMs). N = 5–6/gp. *p < .05 relative to corresponding saline. a p < .05 relative to ORL−/− mice.

