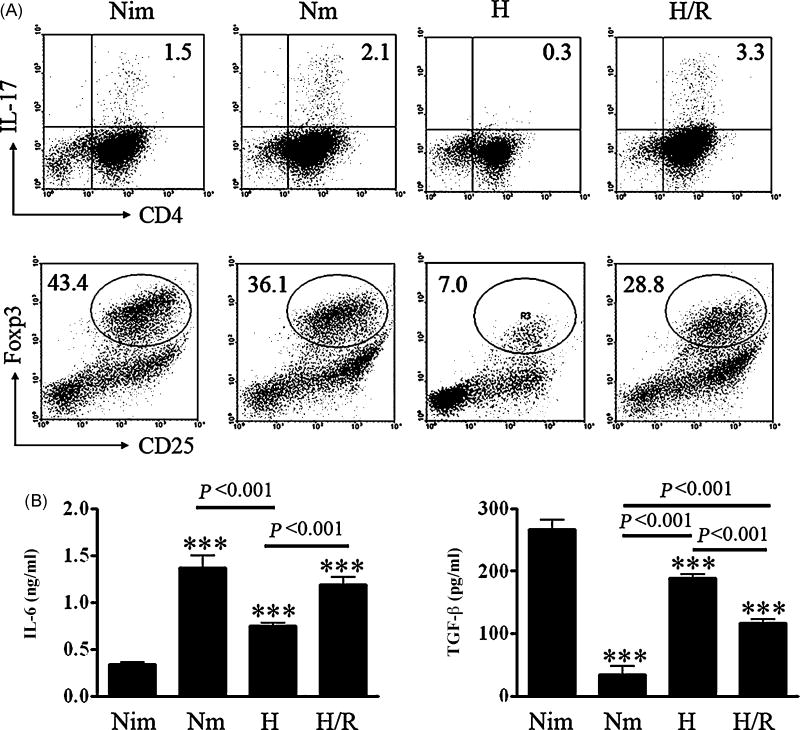
Fig. 6. Differentiation of IL-17-producing cells and Foxp3+ T cells in the coculture with DCs in response to reoxygenation.
(A) MLR was executed as described in Fig. 5A, 5 days later, cells were collected for IL-17A and Foxp3 staining according to the manufacturer’s instructions. Representative data of three independent experiments were shown. (B) Different DCs were prepared and cultured as described in Fig. 3C, supernatants from the DCs cultures were collected at 24 h and assayed for IL-6 and TGF-β secretion by ELISA. Results were from three independent experiments, Means ±S.D. was shown, *** represents P <0.001 versus Nim using one way ANOVA.

