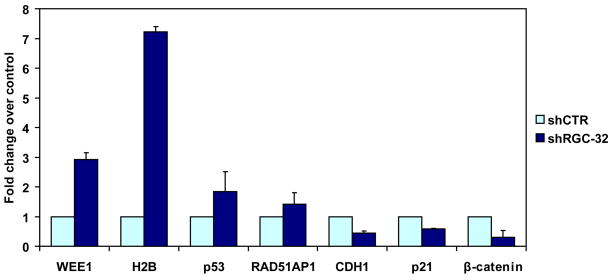
Figure 5. Real-time quantitative RT-PCR for genes selected from the profile.
Seven genes were analyzed by real-time PCR to confirm the microarray results. Changes in mRNA expression similar to those seen in the gene array experiments were found for WEE1, H2BD, p53, RAD1 associated protein 1, and β-catenin. RGC-32 silencing also induces up-regulation of p53 and down-regulation of p21 and CDH1. Data are expressed as fold change over shCTR effect. Data are mean ± SEM from three separate experiments.

