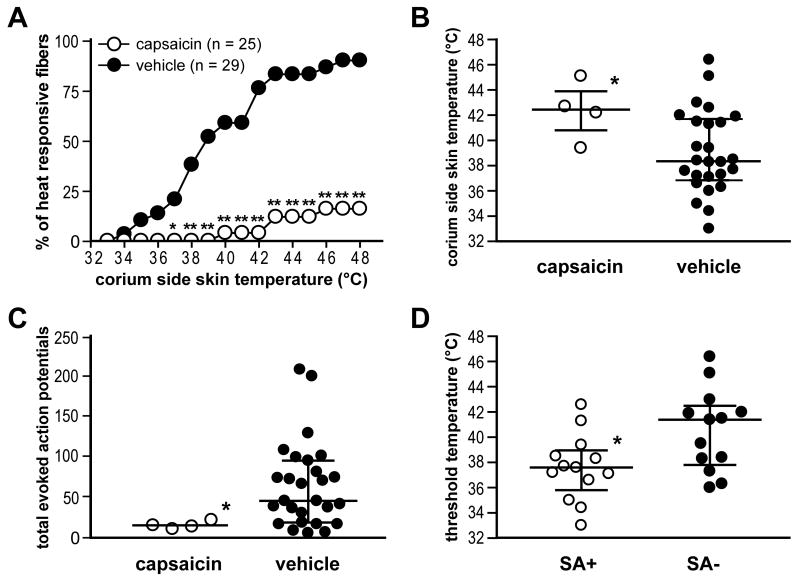
Fig. 6.
Capsaicin treatment decreases heat sensitivity of C-fibers one day after incision. A: The percentage of heat-responsive units at each temperature in C-fibers. A decreased percentage of fibers in capsaicin group (n = 25, ○) respond to 37-48 °C heat compared to those in vehicle group (n = 29, ●) (*P < 0.05; **P < 0.01 vs. vehicle by χ2 test). B: Comparison of threshold temperature for activation of C-fibers between treatment groups. *P < 0.05 vs. vehicle by Mann-Whitney test. C: Comparison of total evoked action potentials by heat-responsive C-fibers between treatment groups. *P < 0.05 vs. vehicle by Mann-Whitney test. In B and C, the horizontal line represents median and vertical line the interquartile range. D: Relation between spontaneous activity and heat sensitivity in C-fibers of vehicle group. The horizontal line represents mean and vertical line the SE. *P < 0.05 vs. SA- by unpaired t-test. SA+ = fibers with spontaneous activity; SA- = fibers without spontaneous activity.

