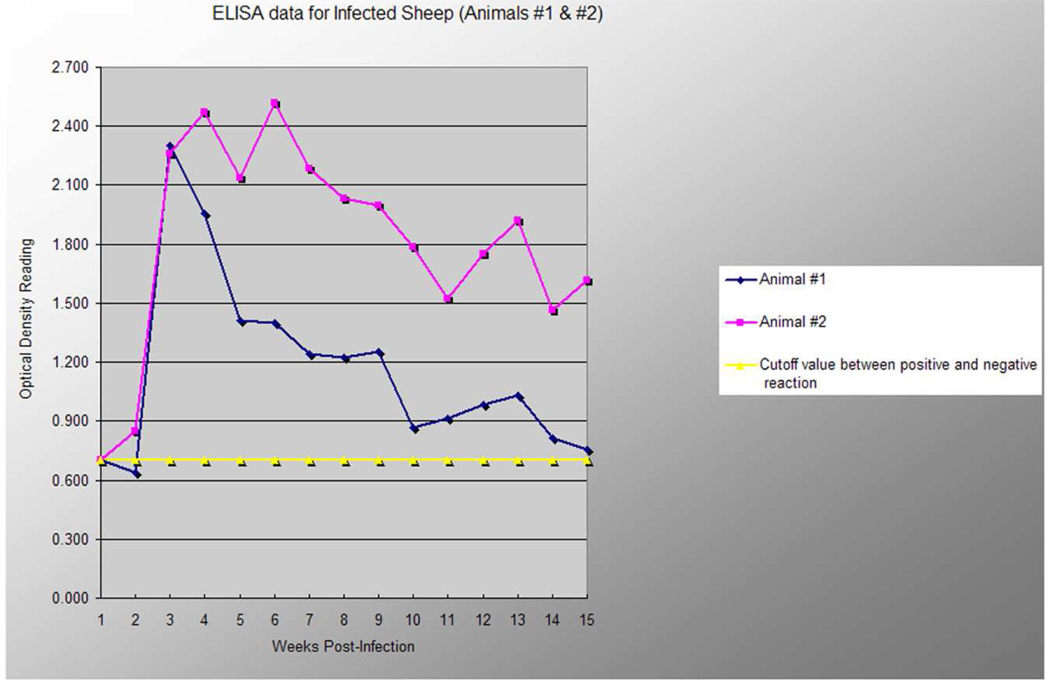
Fig. 5. Diminishing antibody responses to rMSP5 of A. phagocytophilum with time of infection.
A line graph representing the rMSP5 ELISA optical density readings (y axis) on serum samples collected on day 0 through week 15 (x axis) from two lambs experimentally inoculated with viable A. phagocytophilum organisms. The horizontal line demarcates the optical density reading that represents the cutoff between a positive and negative reaction (upper limit of 3 standard deviations above the mean of all negative control samples).

