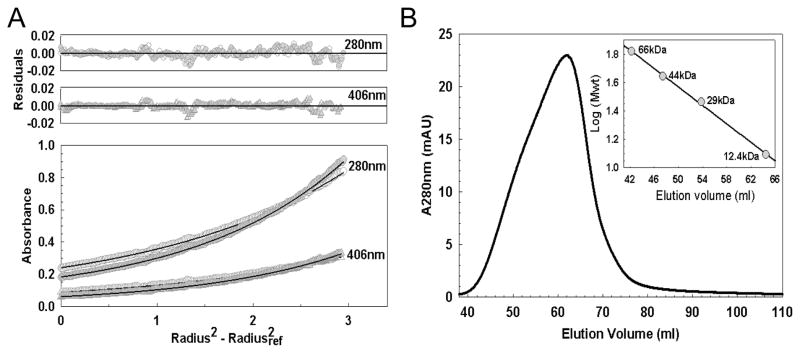
Figure 3. Association state of holo-WhiD.
(A) Equilibrium analytical ultracentrifugation of native-WhiD (21.5 μM) in 50 mM Tris-HCl 250 mM NaCl pH 8.0. The distribution of WhiD was tracked via protein and cofactor absorbancies at 280 nm (circle) and 406 nm (triangle), respectively, in the presence (gray filled) and absence (white filled) of 7 mM DTT, as indicated. Data were fitted to a single component model (black lines, see Experimental procedures) giving a molecular mass of 14.6 kDa and 15.3 kDa in the presence or absence of 7 mM DTT, respectively. Fit residuals are shown above the main plot. (B) Gel filtration chromatogram of native WhiD (450 μM) in 50 mM Tris-HCl 250 mM NaCl pH 8.0. WhiD eluted at a volume corresponding to a molecular mass of ~15 kDa. Inset: Standard calibration curve for the Sephacryl 100HR column.

