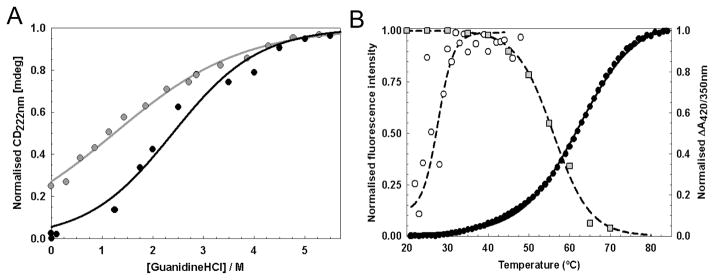
Figure 5. Conformational stability of WhiD.
(A) Chemical denaturation of apo- (gray circles) and native-WhiD (black circles) (14.1 μM protein) in 50 mM Tris-HCl, 25 mM NaCl, pH 8.0 with GdnHCl between 0 to 6 M. Fraction of unfolded protein (as normalised intensity at 222 nm) is plotted as a function of GdnHCl concentration. Apo-WhiD displayed a non sigmoidal transition suggesting it is partly unfolded in the absence of denaturant. Assuming apo-WhiD is ~25% unfolded at zero denaturant, both apo- and native-WhiD fitted to a two-state unfolding model (solid lines, see main text). (B) Thermal denaturation of apo- (open circles) and native- WhiD (filled circles) followed by tryptophan fluorescence changes. The thermal stability of the iron-sulfur cluster was followed by plotting the ratio of A420 nm to A350 nm (gray squares, see Table 1). Lines represent fits of the data obtained using the Cary Eclipse Bio Software or Origin (Microcal) to obtain Tm and ΔGunfold values.

