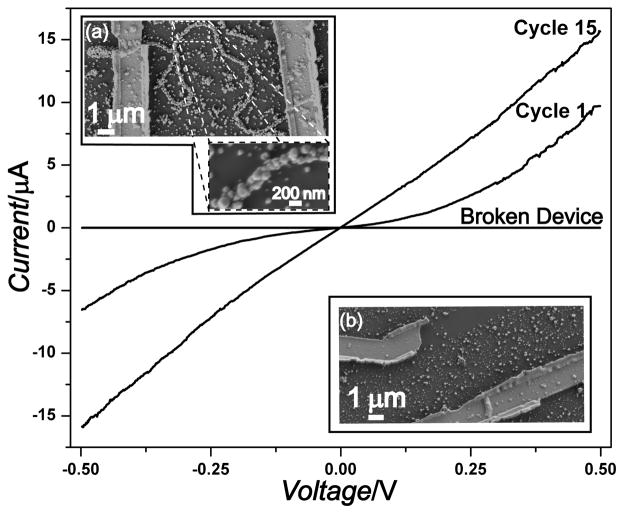
Fig. 4.
Representative current vs. voltage (I–V) curves for the nanowire device shown in the inset (a). The first I-V scan cycle reveals barrier behavior, whereas stable ohmic behavior is observed after repeated I-V scans (Cycle #15). The I–V curve for a broken device shown in the inset (b) shows no detectable current.

