
Table 3.
Relationship between Each Factor and the Three Cohorts
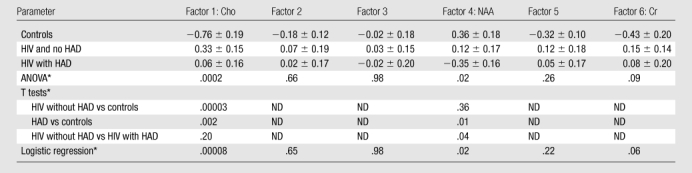
Note.—Unless otherwise indicated, data are the means ± standard error of the mean. HAD = HIV-associated dementia, ND = not determined.
*
Data are P values. Following Fisher least significant difference method, pairwise comparisons were not examined unless ANOVA findings were deemed significant.