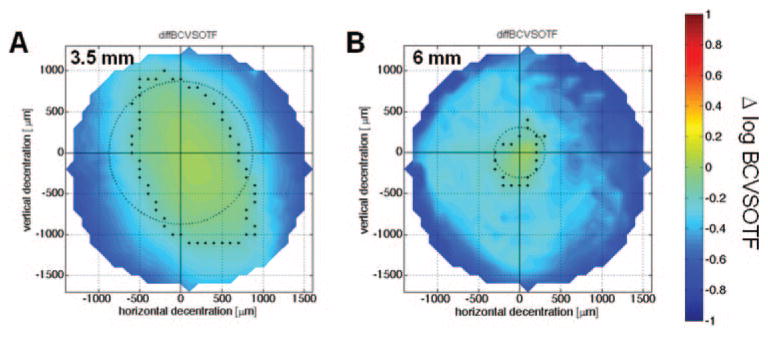
Figure 5.
Decentration map for the change of image quality with best correction (Δ log BCVSOTF) for the right eye of cat 5-005. (A) 3.5-mm PD; (B) 6-mm PD. The center (cross-hair) is set to zero; the dots mark the outmost coordinates with a Δ log BCVSOTF > −0.2; the circle shows the mean tolerance r̄.

