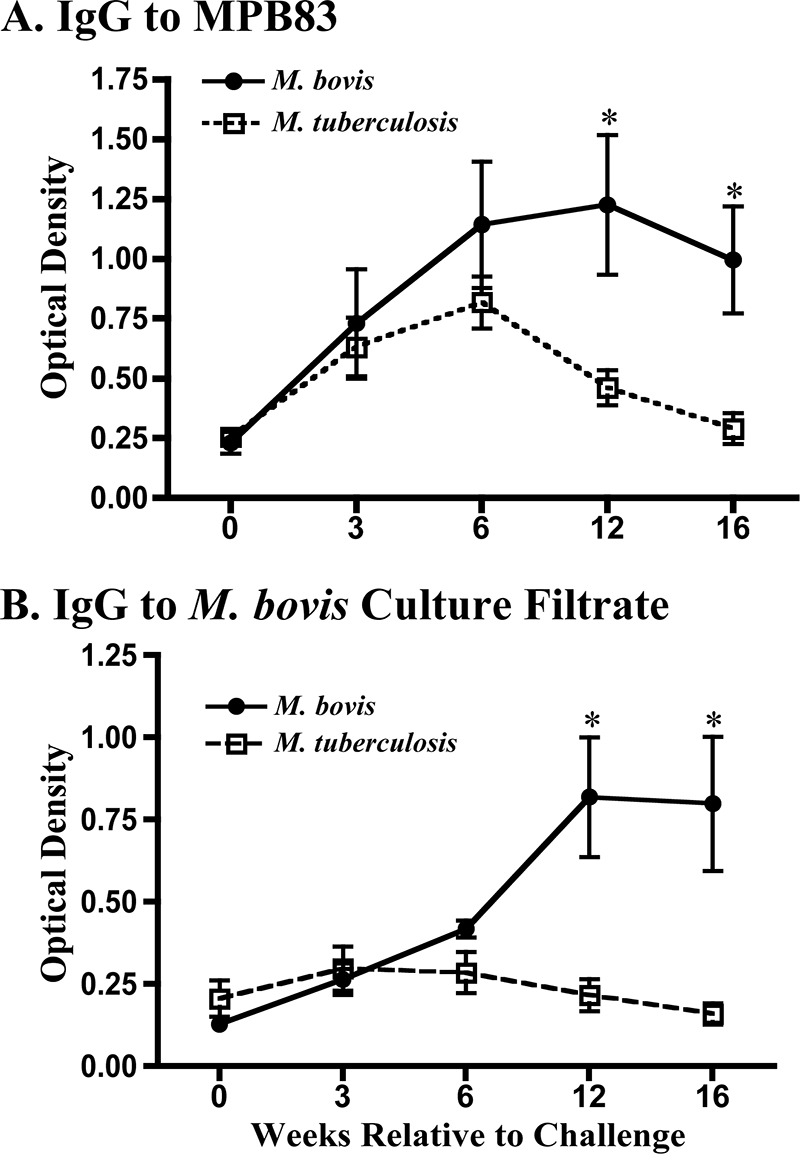
FIG. 2.

Antibody responses upon experimental inoculation of calves with M. bovis (n = 5) or M. tuberculosis (n = 5). Data are presented as the optical densities (means ± SEMs) at 450 nm of the response to MPB83 (A) or M. bovis culture filtrate (B). *, the response was significantly different (P < 0.5) from the response by M. tuberculosis-inoculated animals at the same time point.
