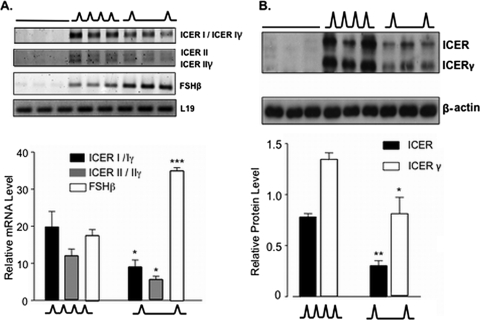
FIG. 3.
ICER mRNA and protein isoforms are preferentially stimulated at high GnRH pulse frequencies. (A) ICER, FSHβ, and L19 mRNA levels were quantified after 20 h of perifusion and stimulation with high (∧∧∧; every 30 min) or low (∧__∧; every 120 min) frequencies of pulsatile GnRH or with medium alone (___). (B) ICER and β-actin protein levels were quantified by Western blot analysis under the same conditions as in panel A. In both panels A and B, the upper panels show the results of a representative experiment. The lower panels show the means ± the SEM of three independent experiments, each performed in triplicate. *, P < 0.05; **, P < 0.005; ***, P < 0.001 (compared to the corresponding mRNA or protein level at the high GnRH pulse frequency [Student unpaired t test]).

