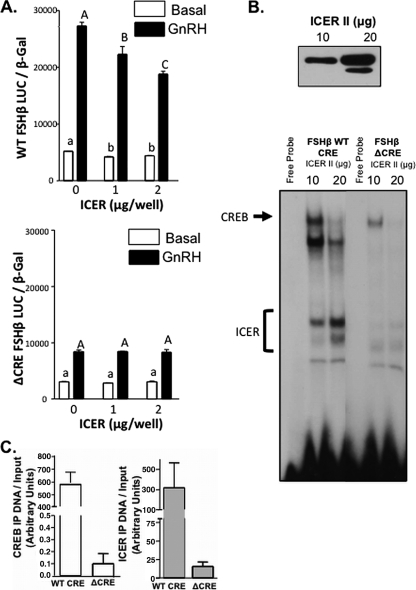
FIG. 6.
ICER-induced suppression of FSHβ transcription is dependent on an intact CRE site. (A) LβT2 cells were cotransfected with either a WT or mutant (Δ) CRE −140/+15 rFSHβLuc reporter and increasing amounts of an ICER II expression vector as indicated, together with 1 μg of a CREB expression vector. LβT2 cells were treated with either 100 nM GnRHAg or medium alone for 4 h. Bar graphs show luciferase activity (means ± the SEM from triplicate samples, normalized to β-galactosidase activity) from a representative experiment, repeated on three separate occasions with comparable results. Significant differences are denoted as different letters as tested by one-way ANOVA with a post hoc Tukey-Kramer multiple-comparison test. (B) Nuclear extracts from LβT2 cells transfected with increasing amounts of an ICER II expression construct (10 and 20 μg per plate) were initially subjected to Western blot to verify increasing ICER II expression (top panel), and nuclear extracts were subsequently used in EMSA studies (bottom panel) with either FSHβ WT CRE or ΔCRE probes. Protein-DNA complexes containing ICER or CREB are indicated. (C) LβT2 cells were transfected with either WT or mutant (Δ) CRE −140/+15 rFSHβLuc and an ICER II expression vector. After 48 h, and after 100 nM GnRHAg treatment for 1 h, the cells were harvested for a ChIP assay with immunoprecipitation with CREB, ICER, or IgG antibodies. Immunoprecipitated DNA was quantified by real-time qPCR with reference to a standard curve generated by serial dilutions of a known concentration of plasmid (as outlined in the ABI prism user manual) and normalized to respective input amounts. The results for CREB (left panel) and ICER (right panel) are represented in the bar graphs (means ± the SEM).

