FIG. 1.
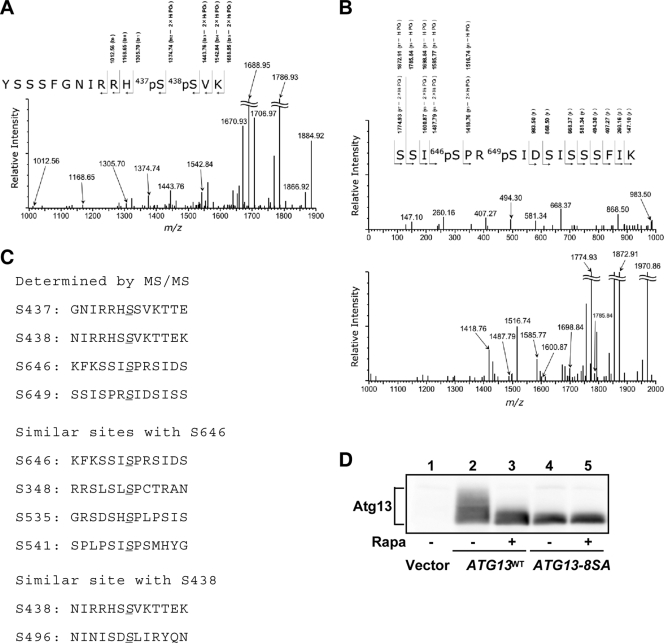
Determination and prediction of Atg13 phosphorylation sites. (A and B) Product ion mass spectra of phosphopeptides 426-YSSSFGNIRRHpSpSVK-440 (A) and 643-SSIpSPRpSIDSISSSFIK-659 (B), obtained from the His6-tagged Atg13 protein. In these spectra, multicharged ion peaks, [M + nH]n+, on ESI mass spectra were converted to single-charged ion peaks, [M + H]+ (protonated molecules). Only monoisotopic ion peaks are shown. Isotopic ion peaks are not shown. (C) Phosphorylation sites of Atg13 mapped by mass spectrometry. Four Ser residues determined by MS/MS analysis (top) and the putative phosphorylation sites similar to the determined Ser sites (bottom) are shown. (D) Immunoblot of Atg13. YEPD-grown cells (OND88) expressing the indicated Atg13 protein were treated with rapamycin (Rapa) (0.2 μg/ml) for 1 h. The phosphorylation state of Atg13 was assessed by immunoblotting.

