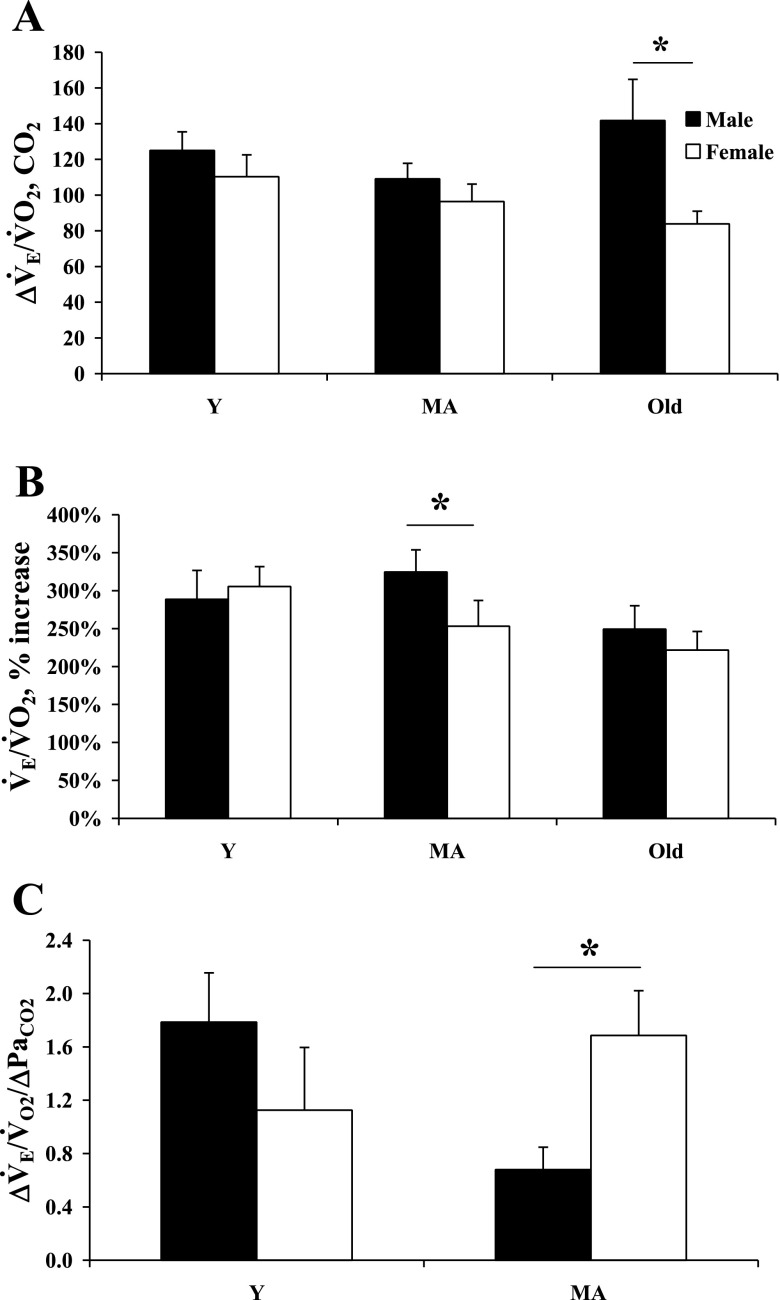
Fig. 2.
Ventilatory response to hypercapnia reported as the change in ventilatory equivalents (ΔV̇e/V̇o2; A), the percent change in ventilatory equivalent ventilation from control (B), and the change in ventilatory equivalents normalized to the change in arterial Pco2 (PaCO2) (HCVR; C) in Y, MA, and old male and female rats during hypercapnia (inspired CO2 fraction = 7%). *P < 0.05.

