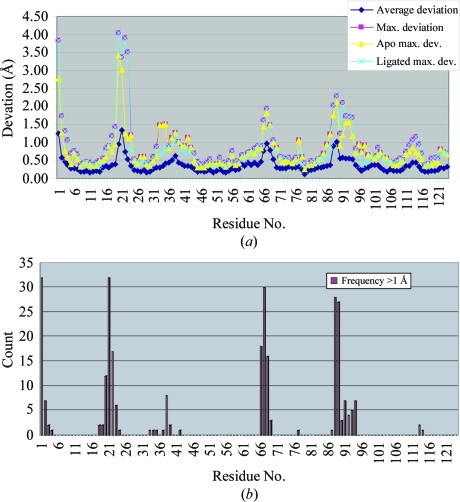
Figure 4.
(a) Plot of the average and maximal deviations of the Cα atoms of each residue of RNase A upon superposition of 56 structures onto the reference structure 1kf5. The maximal deviations for the group of apo structures and the group of ligated structures are also shown, which demonstrates that the high variability of certain regions are independent of the ligation state of the enzyme. (b) Plot of the frequency of deviations greater than 1 Å. For four regions, more than 50% of the structures have deviations from the reference exceeding 1 Å (twice the average r.m.s. deviation of the structures as a group).

