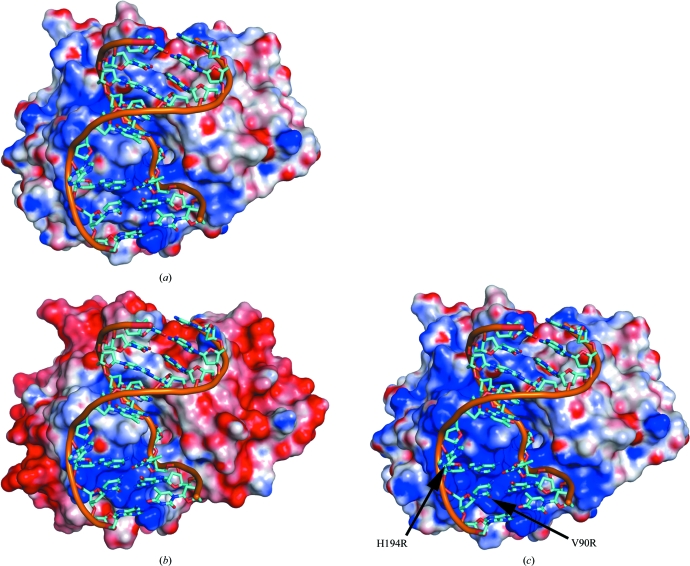
Figure 3.
Estimated electrostatic surface potentials of the crystal structure of vcUNG (a), the homology model of asUNG (b) and the modelled double mutant V90R/H194R of vcUNG (c). The dsDNA from the crystal structure of the complex of hUDG with DNA (PDB code 1emh; Parikh et al., 2000 ▶) has been modelled into all surfaces in order to illustrate the protein–DNA interaction area. The surface potentials are contoured at ±5kT/e, where red describes a negative potential and blue a positive potential. The figure was made by PyMOL (DeLano, 2002 ▶) using an electrostatic surface potential imported from DelPhi (Rocchia et al., 2002 ▶).

