Figure 1.
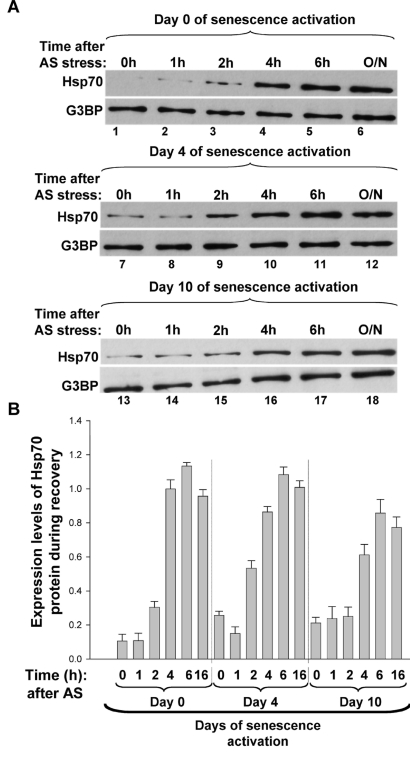
The upregulation of Hsp70 expression correlates with SG disassembly during the recovery from AS stress of proliferative and senescent cells. (A-B) Expression levels of Hsp70 protein after the removal of AS stress. (A) Proliferative and senescent IDH4 cells were incubated with arsenite (0.5mM) for 30 min. Cells were subsequently washed twice with PBS, replenished with fresh media and incubated for various periods of time at 37oC. Total cell extracts prepared from these cells were then used for Western blots analysis with antibodies specific to Hsp70 and G3BP (used as the loading control). Representative western blots of three independent experiments are shown. (B) The bar graphs represent the expression level of Hsp70 protein in each time point normalized to the expression levels of the loading control G3BP. The intensity of the signal in each lane was measured using ImageQuant software. Each bar graph represents the ratio of Hsp70 over G3BP for each time point. The histogram presents the results from (A) as a mean +/- SEM (error bars), from three independent experiments.

