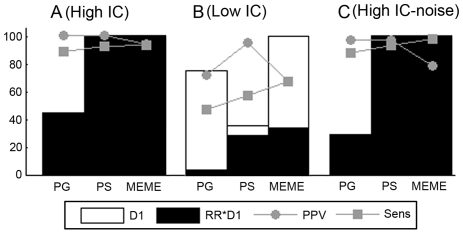
Figure 2. Results for motif detection in the coregulation space.
Each dataset consists of ten coregulated genes from the reference species (proximity 0.80). Panel A displays the results for a synthetic dataset in which all sequences contain a site sampled from a high IC motif (A). Panel B shows the results for a dataset in which all sequences contain a site sampled from a low IC motif (B) and panel C shows the results of a dataset where the motif site is missing in two out of ten sequences. The remainder of the sequences contains a motif site sampled from the high IC motif. Results were assessed by the performance measures D1: the number of datasets with an output out of 100 datasets, D1*RR: the number of datasets with a correct output and the quality measures PPV (the percentage of true sites among the predicted motif sites, averaged over all correct outputs) and Sens (the percentage of the true sites recovered by the algorithm, averaged over all correct outputs).

