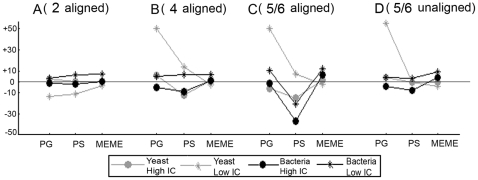
Figure 4. Effect of the number of added orthologs on motif detection in the combined space.
Results on the retrieval of both a high and a low IC motif are displayed for the real datasets: 1) results from the Gamma-proteobacterial datasets are indicated as black curves and 2) those of the Saccharomyces dataset are indicated as gray curves. Results for the high IC motif are indicated by circles and correspond to those obtained for LexA (bacterial dataset) or URS1H (yeast dataset), results for the low IC motif are indicated by stars and correspond to those obtained for TyrR (bacterial dataset) or RAP1 (yeast dataset). The panels represent the results of a dataset containing for each coregulated reference gene two (A), four (B) and six (for the bacterial datasets) or five (for the yeast datasets) prealigned orthologs (the reference gene included) (C). Panel (D) represents the results of a dataset containing for each coregulated reference gene six or five unaligned orthologs (the reference gene included). Results were assessed by the F-value defined as the harmonic mean of the spPPV (the percentage of true sites amongst the predicted motif sites for the reference species, averaged over all correct outputs) and the spSens (the percentage of the true sites found by the algorithm for the reference species, averaged over all correct outputs). The reference species are respectively E. coli (bacterial data) or S. cerevisiae (yeast data). The Y-axis represents the difference between the F-value obtained from searching motifs in the combined coregulation-orthology space and the F-value obtained from searching in the coregulation space only.

