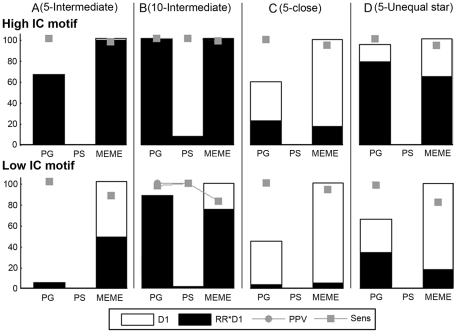
Figure 6. Results for motif detection in the orthologous space.
Results are displayed for a synthetic dataset with motif sites sampled from a high IC (on top) and a low IC motif (below). Each dataset consists of only one reference gene and its orthologs, referred to as one orthologous set. Panel (A) and (B) represent the results when the orthologous set contains respectively five and ten prealigned orthologs related through an equal star topology with a proximity of 0.50. Panel (C) represents the results when the orthologous set contains five prealigned orthologs related through an equal star topology with a proximity of 0.90 and panel (D) represents the results when the orthologous set contains five prealigned orthologs related through an unequal star topology. Note that for most tests the PPV equaled the Sens resulting in overlapping dots. For the measures D1, RR*D1, PPV and Sens see Figure 2.

