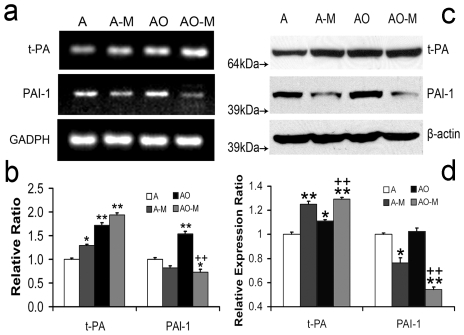
Figure 1. tPA and PAI-1 mRNA and protein levels in treated astrocytes.
qRT-PCR shows mRNA levels of tPA and PAI-1 in normal cultured astrocytes (A), astrocytes co-cultured with MSCs (A-M), OGD astrocytes (AO) and OGD astrocytes co-cultured with MSCs (AO-M) (a). OGD treatment significantly increased tPA and PAI mRNA levels in astrocytes. MSC co-culture significantly increased tPA mRNA level in both normal and OGD astrocytes whereas MSC co-culture significantly decreased PAI-1 mRNA level (b) in OGD astrocytes. Western blot shows protein levels of tPA and PAI-1 in normal cultured astrocytes (A), astrocytes co-cultured with MSCs (A-M), OGD astrocytes (AO) and OGD astrocytes co-cultured with MSCs (AO-M) (c). OGD treatment increased tPA and PAI protein level and co-culture MSCs increased tPA protein level whereas MSCs decreased PAI-1 protein level (d). *P<0.05, **P<0.01, compared with group A; ++P<0.01, compared with group AO.

