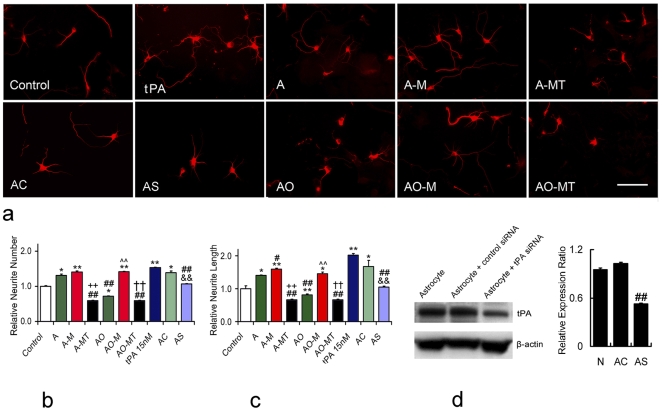
Figure 3. Neurite outgrowth in primary cultured cortical neuron after conditional media treatment.
Fluorescence microscopy (a) shows cortical neurite outgrowth. Control: primary cultured cortical neurons with neurobasal medium; medium from normal cultured astrocytes (A) increased neurite number and total length compared to those in control group; medium from OGD astrocytes (AO) significantly decreased neurite number and total length; media from normal astrocytes co-cultured with MSCs (A-M) and OGD astrocytes co-cultured with MSCs (AO-M) increased neurite total length compared to that in A and AO groups, respectively, and increased neurite number in AO-M group compared with AO group. tPA neutralizing antibody specifically antagonized tPA effects of AM and AO-M groups in neurite number and total length (b, c). Western blot shows that tPA expression in astrocytes was substantially down regulated by tPA siRNA (d). Medium from tPA knock-down astrocytes significantly reduced the neurite number and total length of cultured neurons compared with that from normal astrocytes or negative control siRNA transfected astrocytes (b, c). A-MT: medium from normal astrocytes co-cultured with MSCs, t-PA neutralizing antibody presented; AO-MT: medium from OGD astrocytes co-cultured with MSCs, t-PA neutralizing antibody presented; t-PA: 15nM rh-t-PA alone; AC: medium from astrocytes transfected with negative control siRNA; AS: medium from astrocytes transfected with tPA siRNA. Scale bars = 50 µm. *P<0.05, ** P<0.01, compared with control group; #P<0.05, ##P<0.01, compared with A group; ++P<0.01, compared with A-M group; ∧∧P<0.01, compared with AO group; ††P<0.01, compared with AO-M group; &&P<0.01, compared with AC group. Data are presented as Mean±SE, (neurons n = 50/group, Adjusted p-value = 0.0042).

