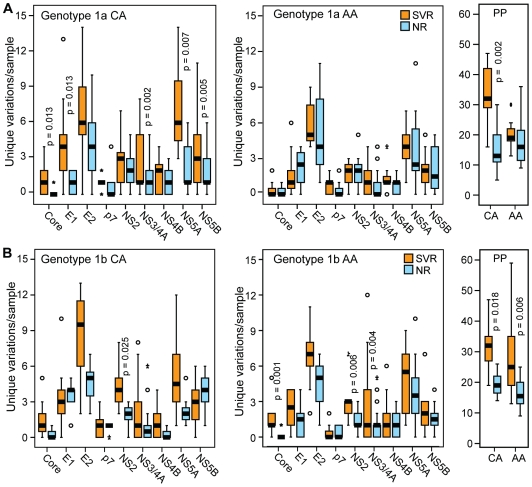
Figure 6. Number of unique variations per sample by treatment outcome and patient race.
The number of variations unique to either the SVR or NR groups is shown for the polyprotein (PP) and for each HCV gene for CA and AA patients. Statistical significance is shown for genes with p≤0.05. (A) Genotype 1a. (B) Genotype 1b.

