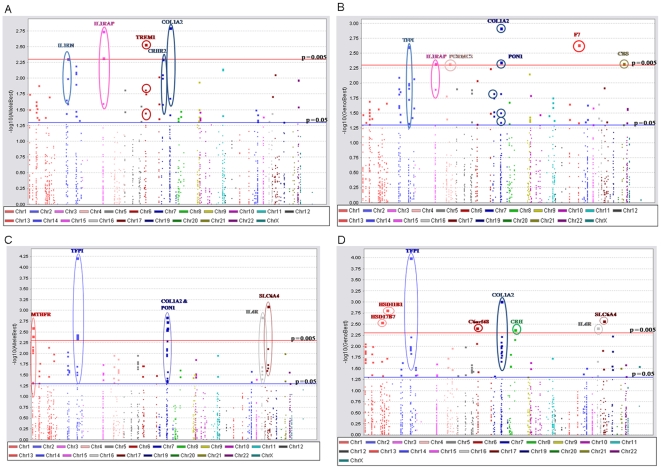
Figure 1. Single locus association results in MoBa study.
Each point on the graph represents an association test either allelic (a, c) or genotypic (b, d). The x axis is SNP position in chromosomal order and the y axis is the inverse negative log of the p-value. Suggestive associations are highlighted in genes with at least one association at p<0.005. TFPI (rs6434222) is significant after correction for multiple testing with FDR. Maternal samples are represented in panels a and b, and fetal samples are represented in panels c and d.

