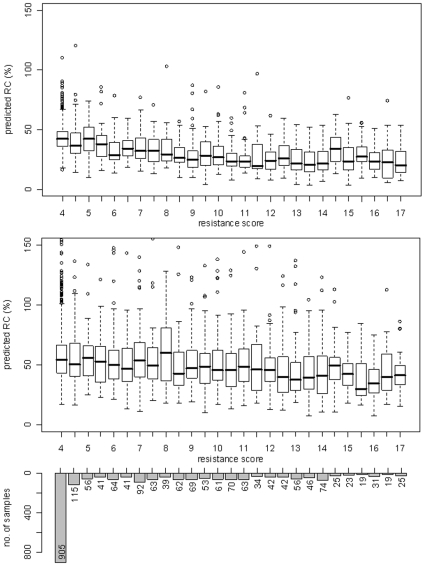
Figure 2. Association between predicted RC and cumulative resistance score.
The underlying clinical dataset and the computation of resistance scores are described in the Methods section. For each discrete value of the score, the distribution of viral RC as predicted from the corresponding genotypes by a model based on Monogram data (top box plot) and Erlangen data (bottom box plot) is shown. The overall Spearman correlation of RC and resistance was −0.534 for Monogram and −0.233 for Erlangen RC predictions.

