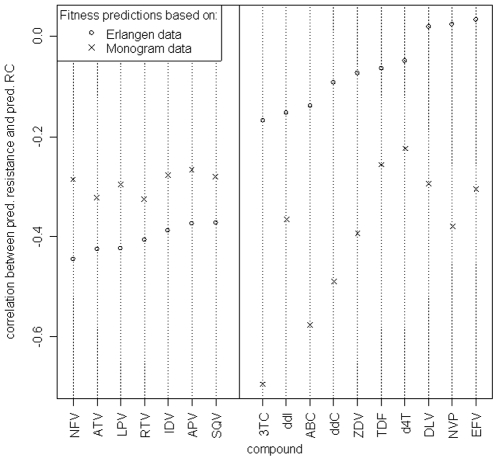
Figure 3. Correlation coefficients of predicted RC and predicted resistance against different antiretroviral drugs.
(PIs: NFV - nelfinavir, ATV - atazanavir, LPV - lopinavir, RTV - ritonavir, IDV - indinavir, APV - amprenavir, SQV - saquinavir; NRTIs: 3TC - lamivudine, ddI - didanosine, ABC - abacavir, ddC - zalcitabine, ZDV - zidovudine, TDF - tenofovir, d4T - stavudine; NNRTIs: DLV - delavirdine, NVP - nevirapine, EFV - efavirenz). For the HIV genotypes in the main clinical dataset, drug resistances with geno2pheno, as well as RC values based on the Monogram dataset and Erlangen dataset, respectively, were predicted. In each case, two RC predictions were made: one using only the protease sequence of the sample, and one using only the reverse transcriptase sequence. (The remaining sequence positions were padded according to the wild-type strain HXB2, in order to comply with our prediction models that were derived from experimental data incorporating both PR and RT.) Spearman correlations between the protease-based RC predictions and the predicted resistances against the different protease inhibitors, as well as between RT-based RC predictions and resistance against the RT inhibitors were computed. The results are shown in the plot, with drugs ordered by increasing correlation according to RC predictions based on Erlangen data.

