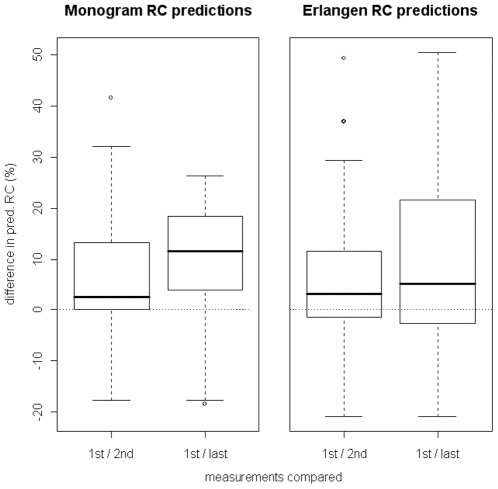
Figure 5. Changes in viral fitness during treatment interruption.
Models derived from the Monogram dataset (left side of the plot) and Erlangen dataset (right side) were used to predict the viral RC corresponding to the genotypes in the treatment interruptions dataset described in Materials and Methods. Shown in the plot are the differences between baseline RC and the first follow-up RC (n = 56) - corresponding to a genotype from about two months into the therapy break -, as well as the differences between baseline RC and the last follow-up RC (n = 30; only if there was more than one follow-up measurement; typically from five to six months into the break).

