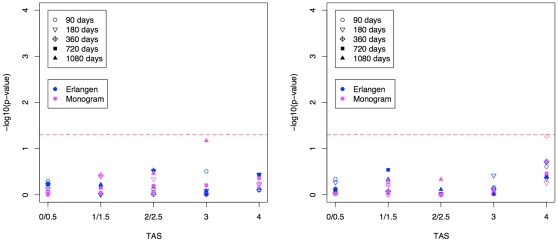
Figure 7. The figure depicts the p-values obtained from a one-sided t-test testing whether predicted RC is lower in patients succeeding a treatment than in patients failing a treatment.
Patients are grouped according to the predicted activity (TAS) of the regimen. Virologic success (left) was defined as reaching the limit of detection, i.e. 50 copies of HIV RNA per one ml blood. Immunologic success (right) was defined as an increase of CD4+ T-cells per one µl blood by 50% or more. Different symbols and colors are used to indicate different time-points of the follow-up measurement and different RC prediction models, respectively. The red horizontal dashed bar represents the 5% significance threshold.

