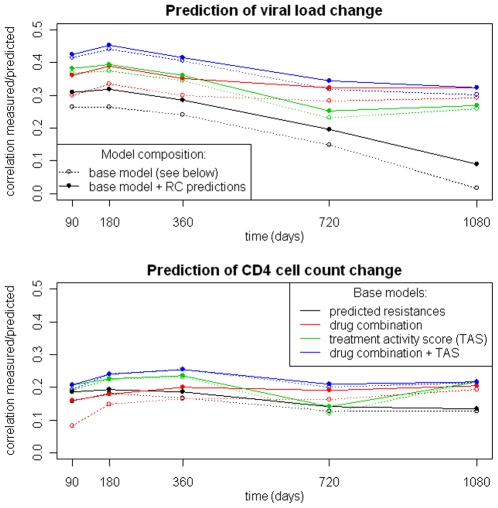
Figure 8. Performance of linear models for the prediction of changes in viral load (top) and CD4+ T-cell count (bottom).
Based on the main clinical dataset, linear models were trained using different sets of input features: 1. predicted resistances against applied drugs, 2. applied drug combination, 3. TAS, 4. drug combination and TAS. Also, for each of these variants, a model that includes two predicted RC values (based on the Monogram and Erlangen datasets) as additional features was considered. This setup allowed us to compare different properties with respect to predictivity of clinical response and to assess the significance of RC in this context.

