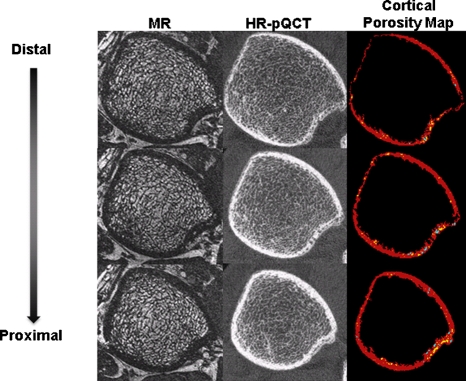
FIGURE 7.
Axial images starting with the most distal slice through the most proximal slice in the analysis region for one subject. The MR images depict cortical and trabecular bone as signal void and marrow as higher in intensity, while the HR-pQCT depict bone as higher in intensity. The cortical porosity map shows cortical bone in red, cortical pores without marrow in yellow, and cortical pores with marrow in blue

