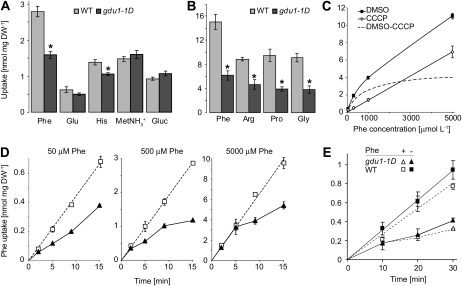
Figure 2.
Analyses of the uptake of radiolabeled 14C-compounds by gdu1-1D and wild-type (WT) plants. A, Accumulation of Phe, Glu, His, methyl ammonium (MetNH3+), and Glc (Gluc) after 10 min (supplied at 1 mmol L−1) in whole plantlets. Wild type, light gray bars; gdu1-1D, dark gray bars. Means ± se of three biological replicates are shown. *, Significantly different from the wild type (t test, P < 0.02). DW, Dry weight. B, Accumulation of Phe, Arg, Pro, and Gly (supplied at 1 mmol L−1) after 1 h in plants. Means ± se of three biological replicates are shown. *, Significantly different from the wild type (t test, P < 0.01). C, Concentration dependence of Phe uptake into wild-type plantlets treated with dimethyl sulfoxide (DMSO; black squares) or CCCP (100 μm; white diamonds). CCCP inhibits the proton gradient-dependent high-affinity uptake system and reveals the activity of the low-affinity uptake system. The difference between the uptake of the dimethyl sulfoxide- and the CCCP-treated plants corresponds to activity of the high-affinity amino acid uptake system, indicated by the broken line. Plants were allowed to take up Phe for 15 min before counting the amount of absorbed radioactivity. Means ± se of three biological replicates are shown. D, Time-course kinetics of the uptake of Phe supplied at a concentration of 50, 500, or 5,000 μmol L−1 in wild-type (white squares) and gdu1-1D (black triangles) plants. Wild-type data points were fitted by the line. Means ± se of three biological replicates are shown. E, Effect of Phe pretreatment on time-course analysis of Phe uptake. Wild-type (squares) and gdu1-1D (triangles) plants were treated (dotted lines, white symbols) or not (solid lines, black symbols) with 1 mm Phe for 30 min prior to uptake analysis performed in the presence of 0.1 mm Phe. Means ± se of three biological replicates are shown.

