Figure 4.
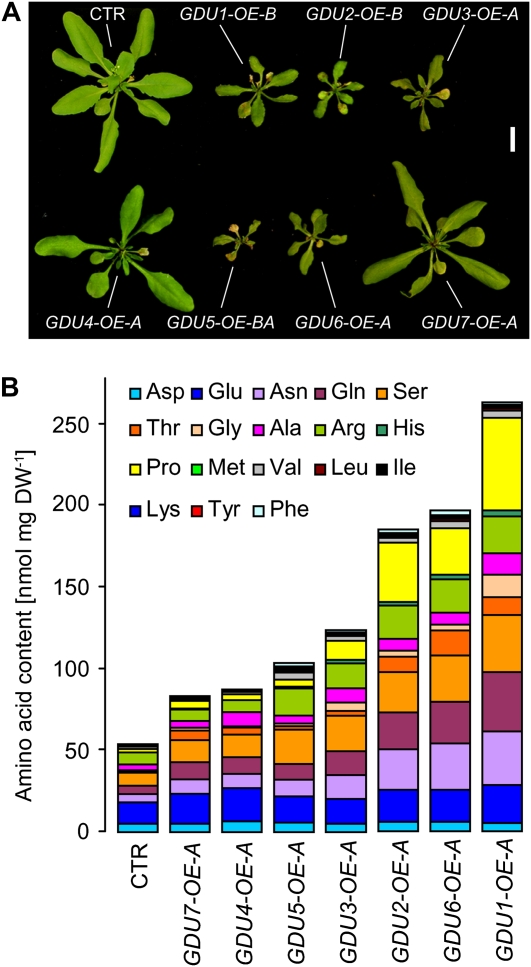
Size and amino acid profiling of plants overexpressing the GDU genes. A, Rosettes of representative plants from one of the two overexpressing lines used in this study (Supplemental Table S1). The amount of secreted crystals at the margin of the leaves was lower for GDU2-, GDU3-, GDU5-, and GDU6-OEs than for GDU1-OEs. Bar = 1 cm. CTR, Plants expressing GFP under the control of the 35S promoter. B, One GDU-OE line per gene (Supplemental Table S1) was selected on kanamycin-containing medium for 7 d, transferred to soil, and grown for 3 weeks more. Leaves from eight plants were pooled and freeze dried. The amino acids were extracted and quantitated by HPLC. DW, Dry weight. Increases in the content of Pro, Gln, Ser, and Asn accounted for 50% to 65% of the total augmentation in free amino acid content, while His and Thr contents were increased the most (5- to 14-fold and 2- to 19-fold, respectively).

