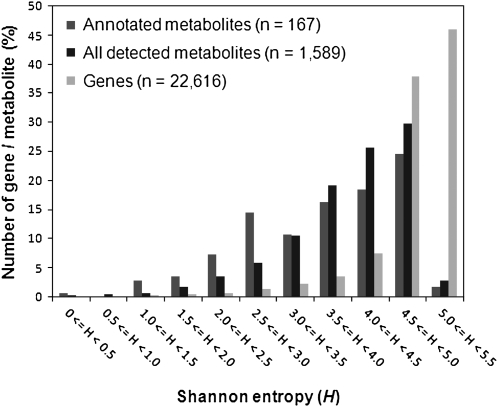
Figure 4.
Frequency distribution of tissue specificity of metabolite accumulation and gene expression. Degrees of specificity were evaluated by determining Shannon entropy levels (H) among 36 tissue samples of Arabidopsis. Higher and lower entropy levels, respectively, indicate lower and higher tissue specificity.

