Figure 1.
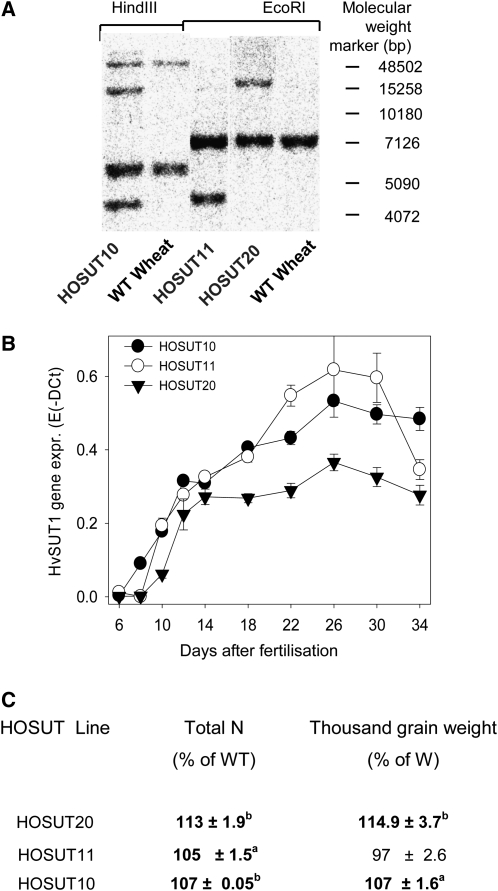
Characterization of HvSUT1-overexpressing wheat lines. A, Independent lines HOSUT10 (T4 generation), -11, and -20 (T2 generation) were analyzed for transgene integration by DNA gel-blot analysis. WT, Wild type. B, Quantitative real-time PCR analysis of HOSUT caryopses for transgene expression. Values are means of three biological replicates ± sd. C, Total nitrogen (N) and thousand grain weight of mature HOSUT grains (greenhouse grown). n = 5 to 10 ± sd. Significant differences according to t test are as follows: aP < 0.05, bP < 0.01. W, Wild type.

