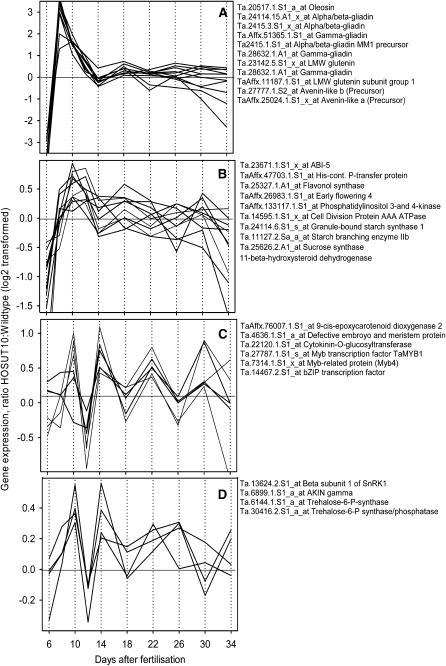
Figure 4.
Ratios of gene expression, HOSUT10:wild type. Gene expression was determined by quantitative real-time PCR at 10 stages of development with three biological replicates. Data were extracted from Supplemental Table S2 and are log2 transformed. A, Storage protein and storage-associated genes. B, Genes revealing a cluster similar to that presented in A. C and D, Genes revealing a cluster inverse to that presented in B. For full description of genes, see Supplemental Table S2. Identifier numbers refer to the Affymetrix GeneChip.

