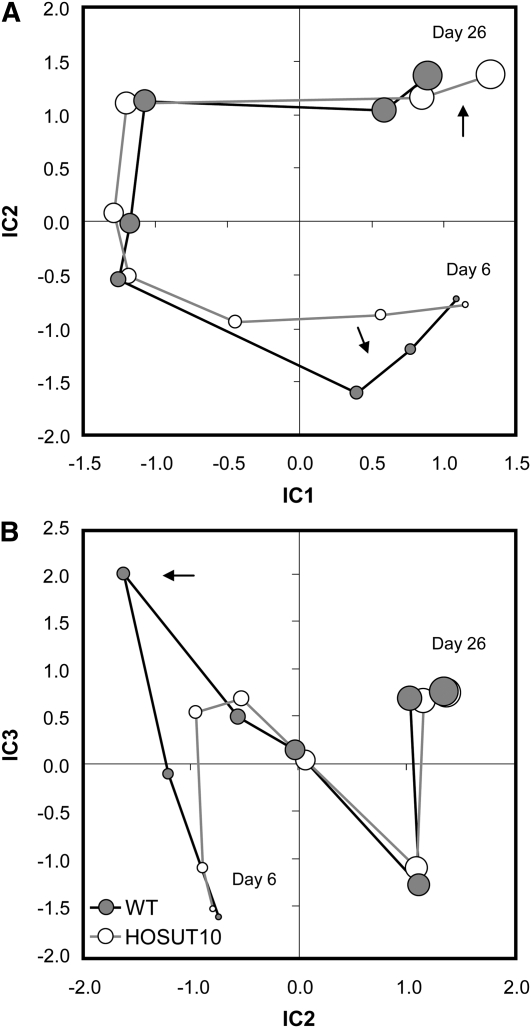
Figure 5.
Independent component (IC) analysis based on the median centered and log10-transformed response ratios. The graph shows that deviations of metabolite levels during grain development occur in the early phase DAF 8 to 10 (arrow in B) and the late phase (26 DAF), indicating a continued development in transgenic grains at day 26 (arrow in A). The size of each circle indicates its developmental stage: smallest circle, 6 DAF; largest circle, 26 DAF. WT, Wild type.

