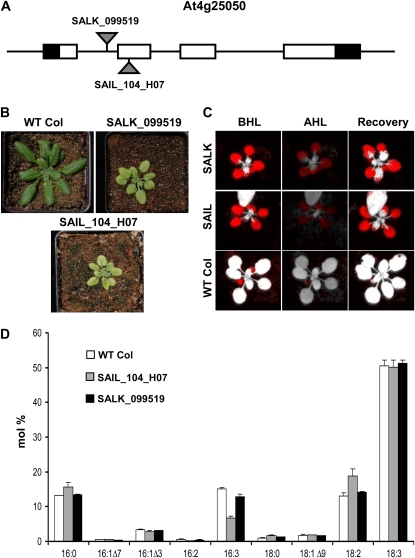
Figure 3.
Molecular basis and associated phenotypes for two ACP4 (At4g25050) T-DNA alleles. A, SALK_099519 contains an insertion in intron 1 of At4g25050, and SAIL_104_H07 contains an insertion in exon 2 of At4g25050. Schematic representation of the gene model and alleles is as described in the Figure 1 legend. B, Small size and pale green appearance of SALK_099519 and SAIL_104_H07 compared with a Columbia wild-type plant (WT Col). C, Fv/Fm values were calculated before high light (BHL), after plants were exposed to 3 h of high light (1,500−1,700 μE m−2 s−1; AHL), and after a 2-d recovery period (Recovery) using the MAXI version of the IMAGING-PAM M-series chlorophyll fluorescence system (Heinz-Walz Instruments). Wild-type control plants were used to assign cutoff values for Fv/Fm under each condition. Red coloring in the false-color images indicates tissues that were below the wild-type cutoff value for Fv/Fm. D, Altered leaf fatty acid composition of SALK_099519 and SAIL_104_H07 compared with wild-type plants. Error bars represent sd values for two biological replicates.

