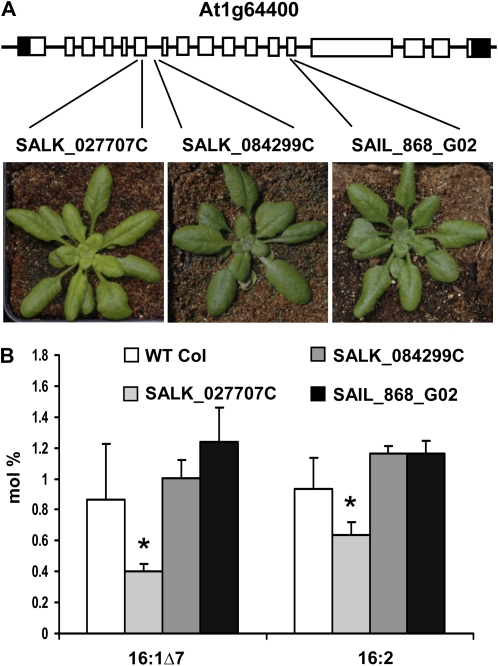
Figure 4.
Inconsistent phenotypes of three At1g64400 T-DNA insertion lines. A, Insertion sites and photographs of representative plants for each mutant line. Schematic representation of the gene model and alleles is as described in the Figure 1 legend. B, 16:1Δ7 and 16:2 FAME levels of wild-type (WT Col), SALK_027707C, SALK_084299, and SAIL_868_G02 lines as measured by GC-FID. Statistically significant differences between each mutant and the wild type (Student's t test, P < 0.01) are depicted by asterisks. Error bars represent sd values of four biological replicates for SALK_027707C and SAIL_868_G02 and three biological replicates for the wild type and SALK_084299.

